How Can We Help?
🖋️ How to Navigate the Dashboard
The Take5™️ Connect Dashboard provides a comprehensive overview of your account’s activities, safety metrics, and user engagement. This guide will walk you through the key features and functionalities of the Dashboard to help you monitor and manage your sites effectively.
Step 1: 📊 Understanding the Dashboard Overview
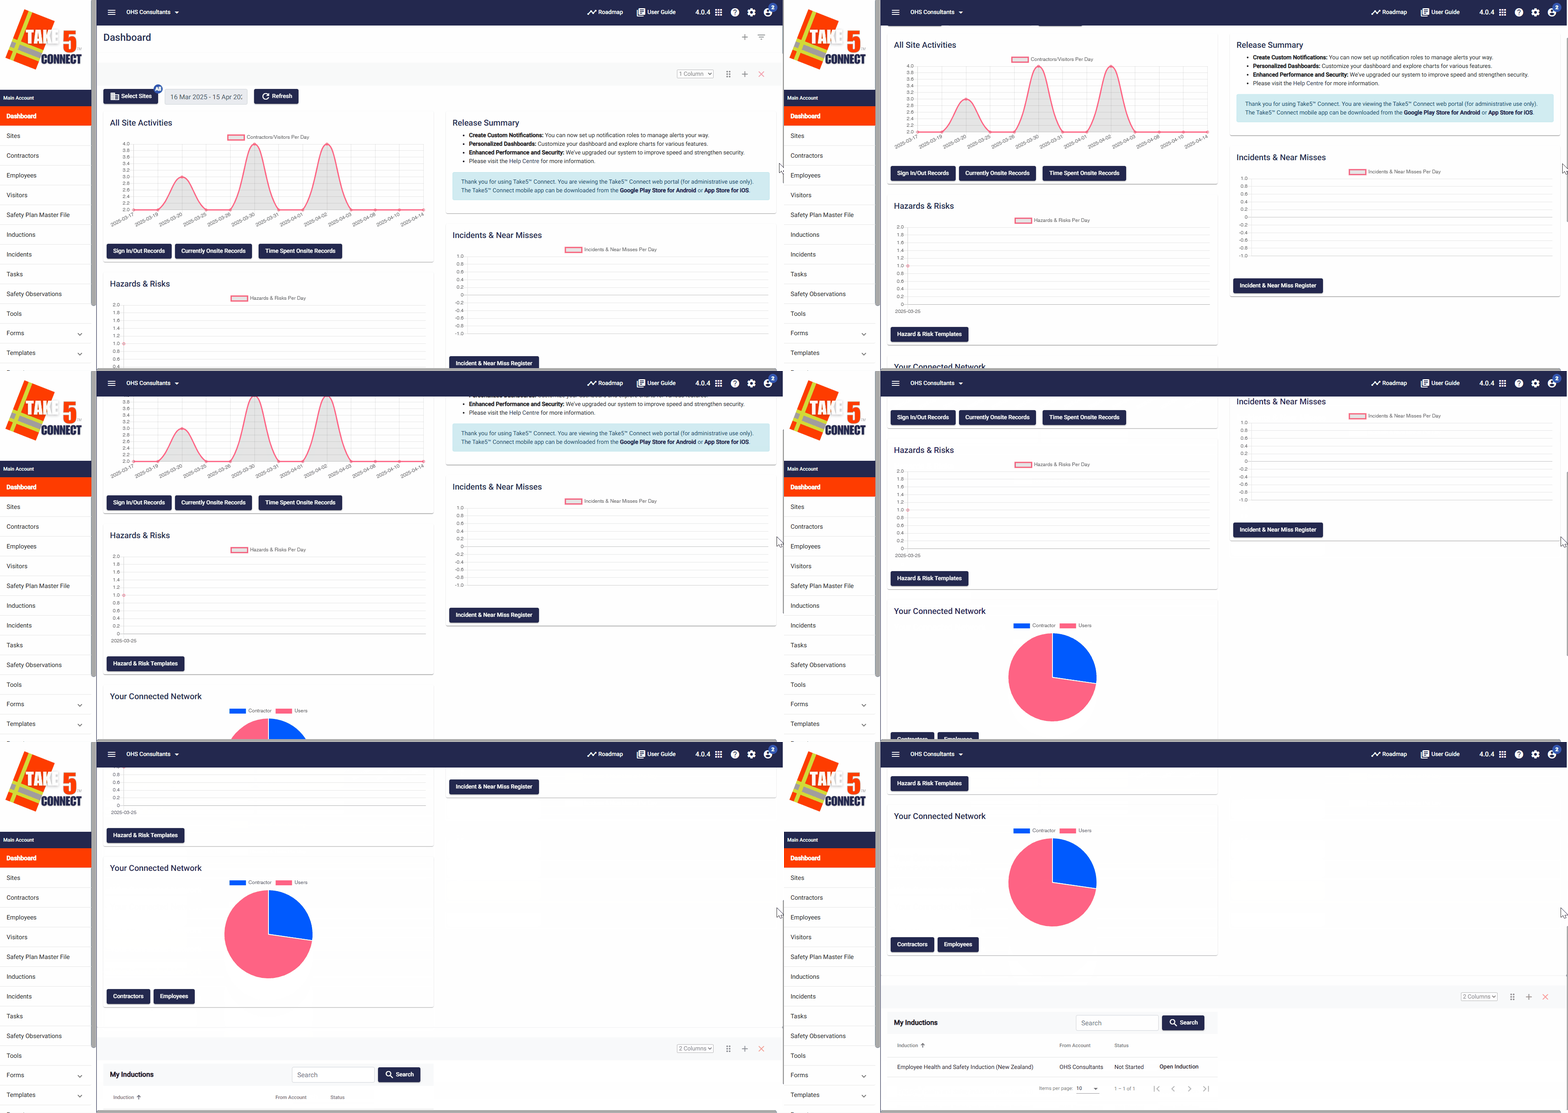
Upon logging in, you’ll be directed to the Dashboard, where you can view various metrics and reports:
- All Site Activities: Displays a line graph showing the number of contractors and visitors per day across all sites. Use the Select Sites button to filter by specific sites and adjust the date range to customize the data view.
- Hazards & Risks: Shows the number of hazards and risks logged per day. Click the Hazards & Risk Templates button to access and manage hazard and risk templates.
- Incidents & Near Misses: Displays the number of incidents and near misses logged per day. Click the Incident & Near Miss Register button to view detailed incident records.
- Your Connected Network: Presents a pie chart illustrating the ratio of contractor businesses to users in your network. Click the Contractors or Employees buttons to access detailed lists of contractors and employees.
- Inductions: Lists inductions that need to be completed within your account.

Step 2: 🔄 Customizing Your Dashboard View
To tailor the Dashboard to your needs:
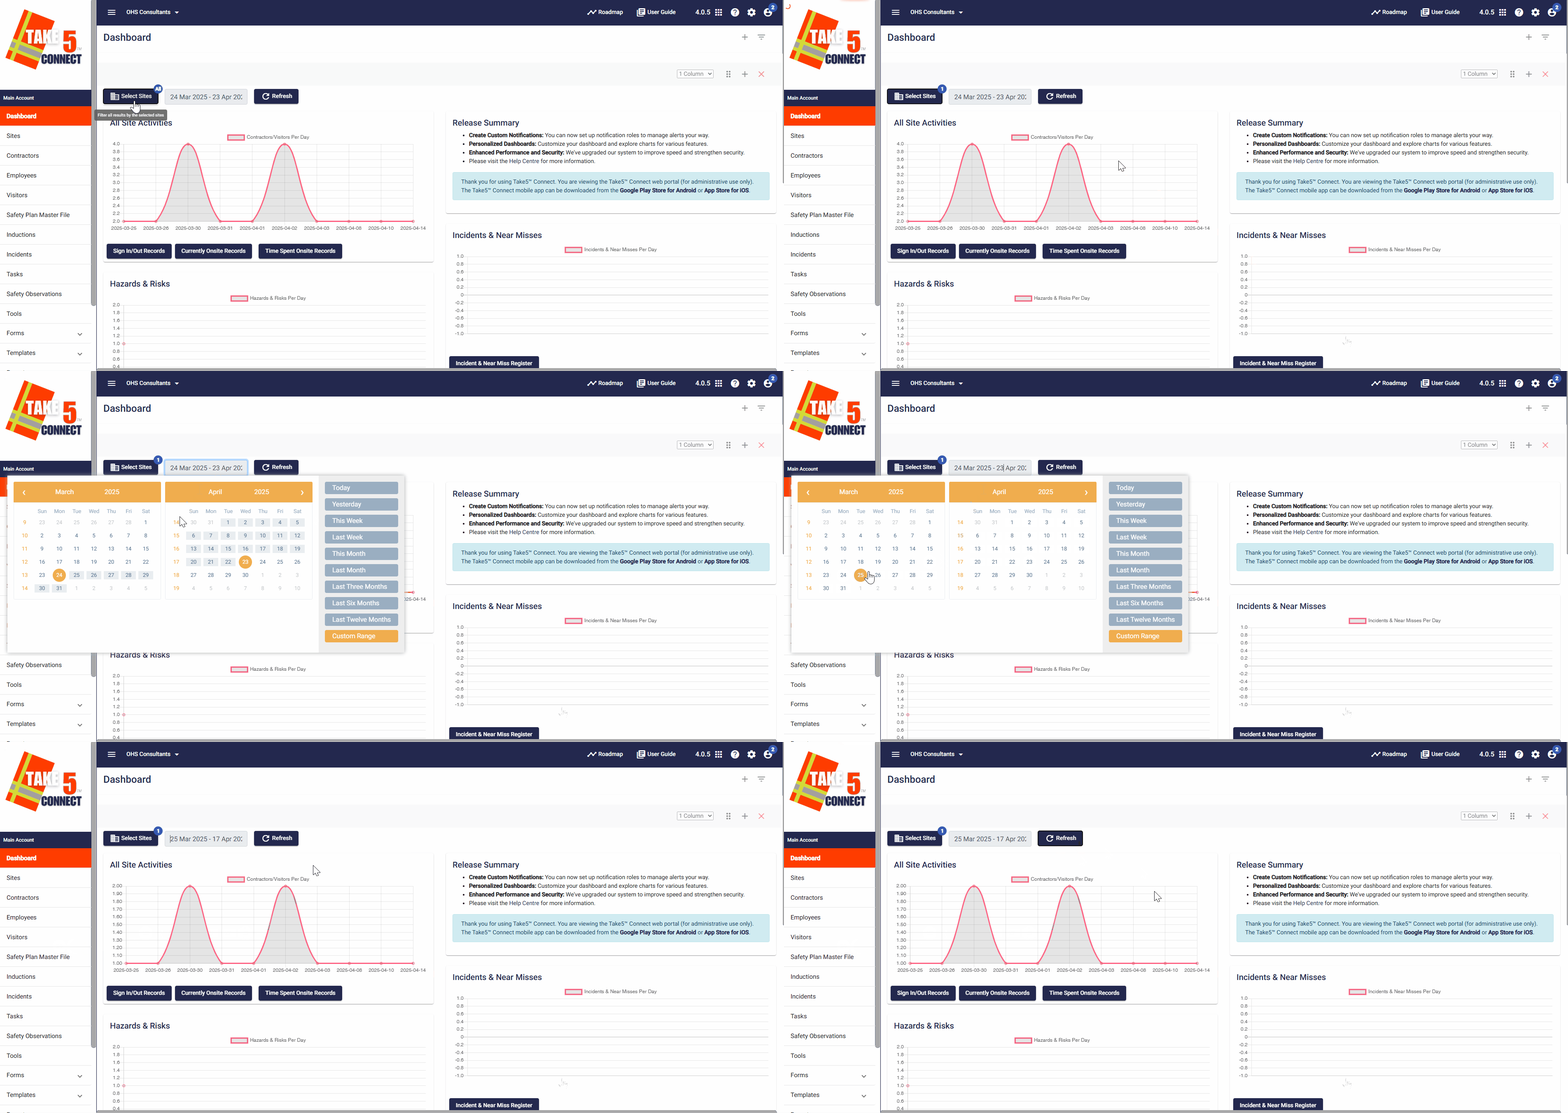
- Select Specific Sites: Click the Select Sites button above the graphs to choose which sites’ data to display.
- Adjust Date Range: Click the date range box next to the Select Sites button to open a calendar view. Select the desired start and end dates, then click Refresh to update the graphs accordingly.

Step 3: 📈 Analyzing Data and Generating Reports
The Dashboard offers various reporting functions:
- Real-Time Data: Monitor live data on site activities, hazards, incidents, and inductions.
- Historical Data: Access past data to identify trends and patterns over time.
- Export Data: Download raw data for custom in-house reporting or analysis.
❓ Troubleshooting
- Data Not Updating: Ensure that the correct sites and date ranges are selected. Click Refresh to reload the data.
- Missing Data: Verify that the relevant activities (e.g., hazards, incidents) have been logged correctly in the system.
- Access Issues: Confirm that you have the necessary permissions to view and manage the Dashboard.
📞 Need Help?
If you need further assistance, please contact our support team at:
- 📧 Email: support@take5connect.com
- 📞 Phone (NZ): 0800 582 535
