")
How Can We Help?
📊 How to Create and Manage Dashboard Charts
Take5™ Connect allows you to create and manage charts to visualize data, making it easier to track progress, identify trends, and generate reports. This guide will show you how to create, customize, and manage charts in the system. 👇
Step 1: 📊 Access the Charts & Graphs Section
- Once logged in, navigate to the Dashboard tab on the left-hand menu.
- Under the Dashboard section, the Charts & Graphs default view is displayed on the screen.
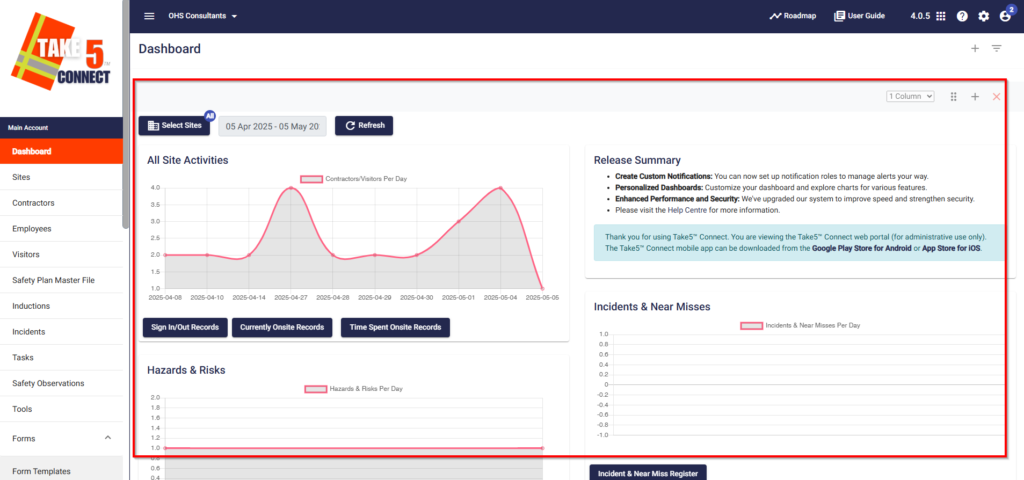
Step 2: 🛠️ Create a New Chart
- Click on the ➕ button located at the top of the Charts & Graphs page.
- A new window will appear where you can configure your chart.
- Select the number of columns you would like in your row (either 1 or 2 graphs can be displayed in one row on screen).
- Select the data set you want to visualize (e.g., incidents, tasks, inspections) from + button dropdown menu that now appears.
If you receive an error message it means you have reached the maximum number of charts already. Delete one of the charts and add a new chart.
Step 3: 📈 Customize Your Chart
- Click the dropdown menu that appears next to your selected data set.
- Choose the chart (e.g., Incident, All Site Activities, Hazards, etc.) that best represents your data needs from the + button that appears here.
- Customize the chart by selecting filters, such as date ranges, specific sites, or departments.
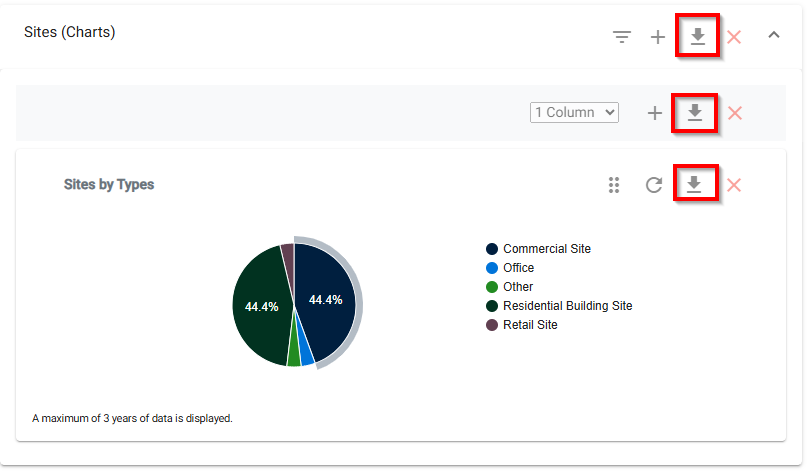
Step 4: 💾 Export Your Chart
- Once you’ve finished customizing the chart, you are able to Export it
- Export the chart as a PDF or Excel file for use in reports and presentations, by selecting the download arrow button.
Step 5: 🔄 Manage Your Charts
- To view or edit existing charts, return to the Dashboard section.
- Click on the chart you want to edit or delete from the list of saved charts.
- Make adjustments as needed, or remove old charts that are no longer relevant by selecting the Delete option.
❓ Troubleshooting
- If a chart isn’t displaying data correctly, double-check your data filters to ensure they are correctly applied.
- For large data sets, it may take a few seconds for the chart to load. If issues persist, try refreshing the page or reselecting your data.
📞 Need Help?
If you need further assistance, please contact our support team at:
📧 Email: support@take5connect.com
📞 Phone (NZ): 0800 582 535