")
📊 How to Create and Manage Charts & Graphs
The May 2024 Release of Take5™ Connect includes enhanced features for creating and managing charts and graphs, offering more flexibility and customization options. Follow this guide to learn how to take advantage of these new features. 👇
Step 1: 📊 Access the Charts & Graphs Section
You can access and manage charts for the following features: Dashboard, Sites, Inductions, Incidents, Safety Observations, Tasks, Forms, Hazards & Risks, Inspections & Audits, Site Activity, Toolbox Talks, and Messages.
Within each module that Charts & Graphs apply to there will be an option to click on the Charts tab at the top of the page, which opens up a list of the available Modules.
- Once logged in, navigate to the Dashboard area on the left-hand menu.
- Under the Sites (or any of the sections of the chart) section, select Charts & Graphs at the top bar to view the available options for data visualization.
Step 2: 🆕 New Features in the May 2024 Release
- The May 2024 Release introduces several enhancements, including:
- Advanced Filtering: More precise control over data selection with multi-layer filters.
- Customizable Chart Layouts: Choose from a wider range of chart types and customize them with different colors, fonts, and label positioning.
- Real-Time Data Updates: Charts now automatically refresh when data is updated.
Step 3: 🛠️ Creating a New Chart with Enhanced Features
- Select the desired data set (e.g. incidents, messages, forms) from the top bar menu, where you wish to create a chart or graph.
- Click the + button at the top of the Charts & Graphs page.
- Select the type of Chart or Graph you want the data to be displayed in.
- Use the new Advanced Filters to narrow down your data by specific parameters like date ranges, location, or project type, through the Filter button.
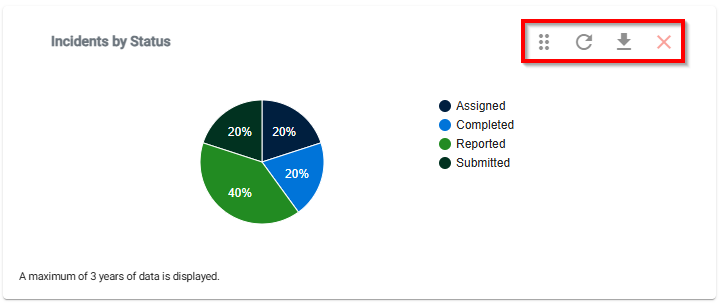
Step 4: 💾 Individual Chart & Graph Controls
- Once the chart or graph has been created, they have a selection of functions.
- Drag Handle: Click and drag the chart or graph to position it within the row.
- Refresh: Click to refresh the screen view and update the chart with the latest data.
- Download: Download the chart or graph as an image file.
- Remove: Delete the chart or graph.
❓ Troubleshooting
- If the new features are not visible, ensure that your account is updated to the May 2024 Release.
- For charts with large data sets, it may take a moment for them to load. Refresh the page if the chart doesn’t display correctly.
- Make sure to save your filters and customizations before exiting to prevent loss of changes.
📞 Need Help?
If you need further assistance, please contact our support team at:
📧 Email: support@take5connect.com
📞 Phone (NZ): 0800 582 535